

This is the Shopify case study I'm most proud of. Gold Star Fragrances is a family-owned fragrance shop in New York, open since 1976, with 3,000+ fragrance oils inspired by designer perfumes. We moved them from SunShop to Shopify on September 12, 2025, and we've worked on the store every month since: design, code, conversion, emails, SEO, the affiliate program and now Meta ads.
Since the move, the store has made $1M+ in sales (Shopify analytics, September 12, 2025 to November 18, 2026).
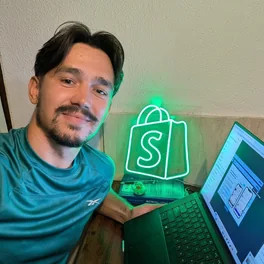
I'm Nick Ursu. I've worked only on Shopify for 9+ years, and my team has done 1,300+ Shopify projects since 2017. If you run a store that already sells and you want one team to scale it, this is what that work looks like.
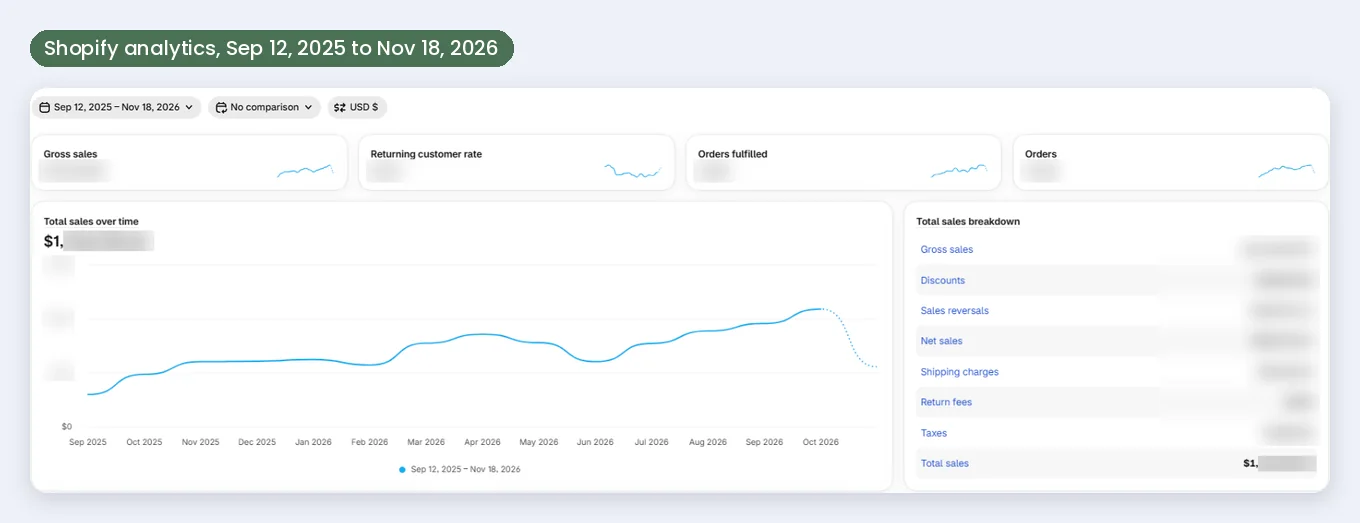
Shopify analytics, September 12, 2025 to November 18, 2026.
Quick overview
- Store: goldstarfragrances.com, fragrance oils, sprays and body care, New York
- Result: $1M+ in sales in the first 14 months on Shopify
- Best month so far: October 2026, $109,173 in sales
- Conversion: 2.85% in month 1, 5.11% at the best month, 4.26% in October
- Emails: 43% of the store's sales in the last 90 days came from Omnisend
- Affiliates: 123 creators selling for the store
- Who does what: Angela runs the brand and brings the traffic (content, creators, new scents, new ideas). We make that traffic buy and come back: the website, conversion, emails and the backend, fully managed.
- What we do every month: design, development, conversion tests, emails, SEO, affiliates and Meta ads
The numbers: month 1 vs now
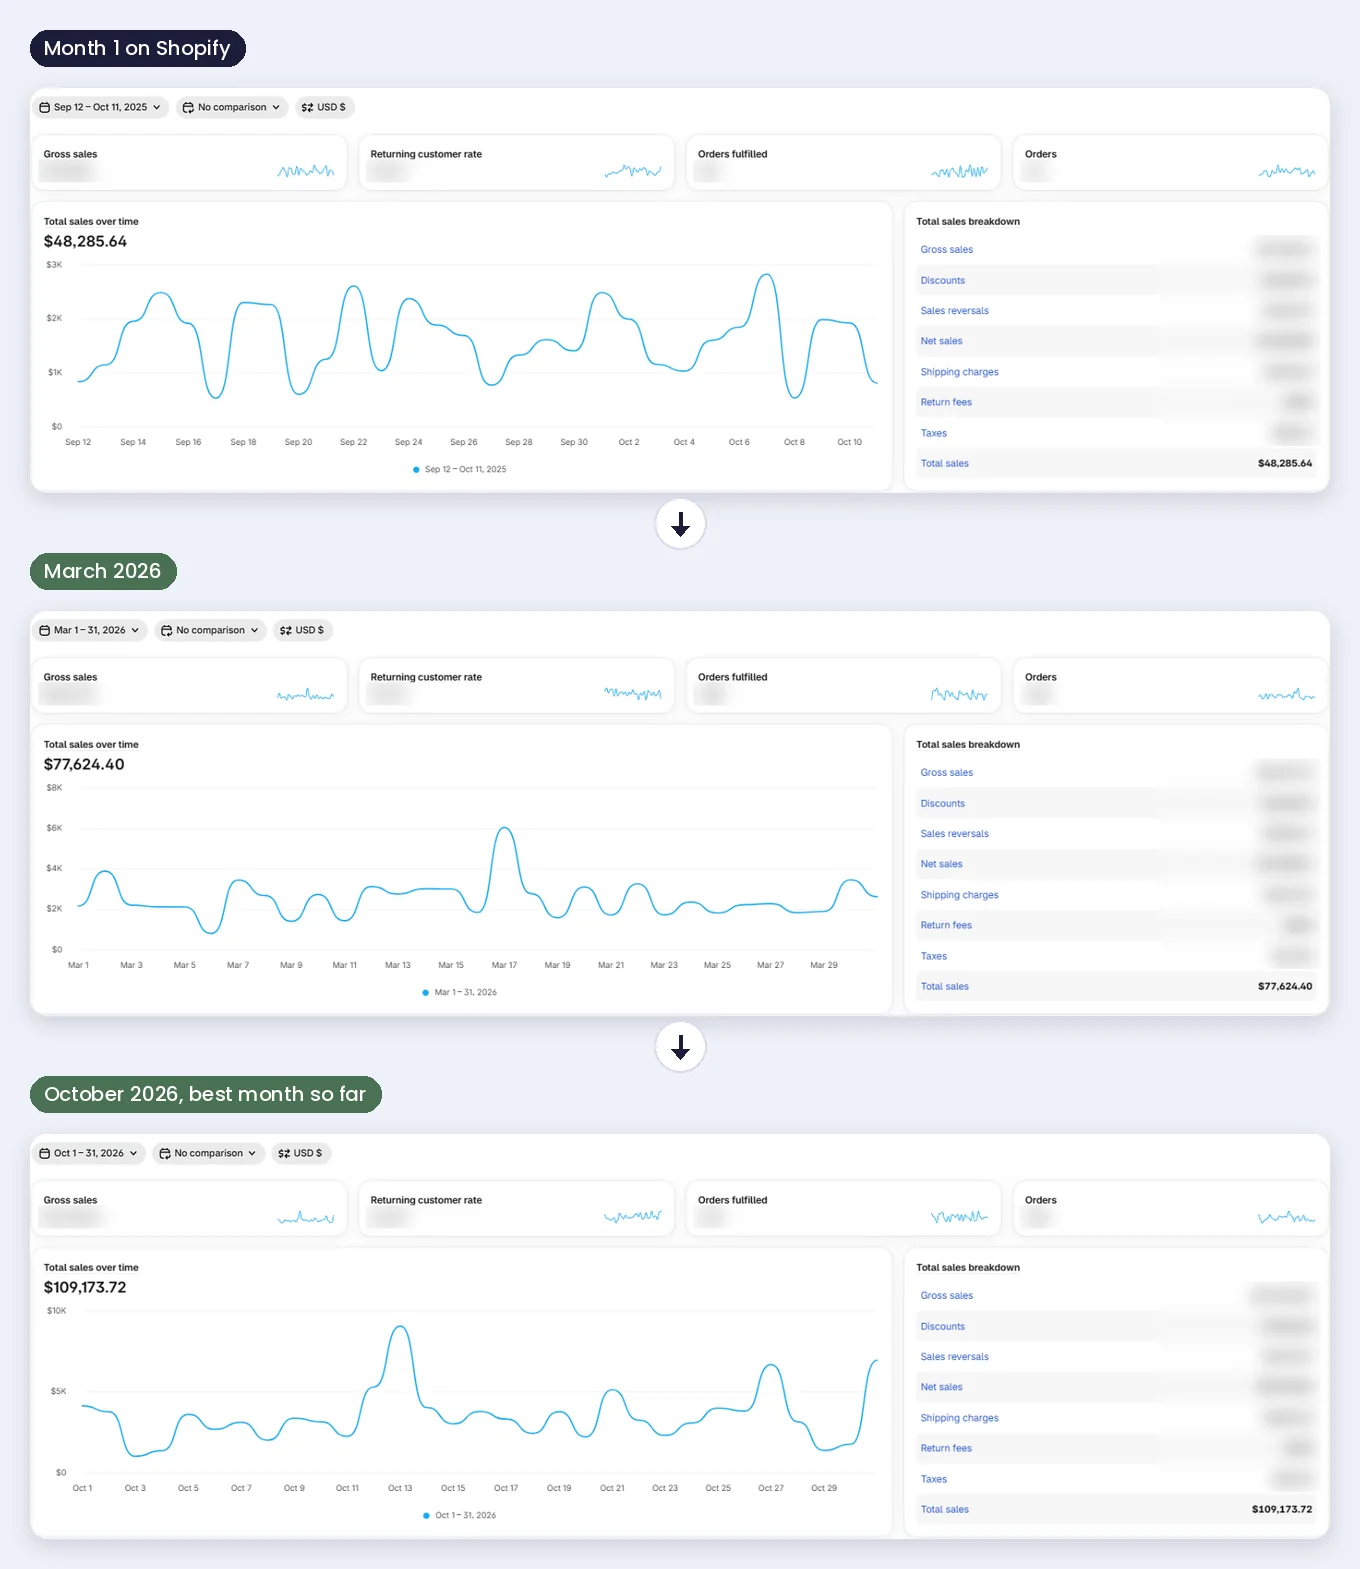
The same Shopify dashboard for 3 different months.
This is how sales went on Shopify, month by month:
| Period | Total sales | Added to cart | Conversion |
|---|---|---|---|
| Month 1 (Sep 12 to Oct 11, 2025) | $48,285 | 11.33% | 2.85% |
| March 2026 | $77,624 | 18.63% | 5.11% |
| October 2026 | $109,173 | 18.18% | 4.26% |
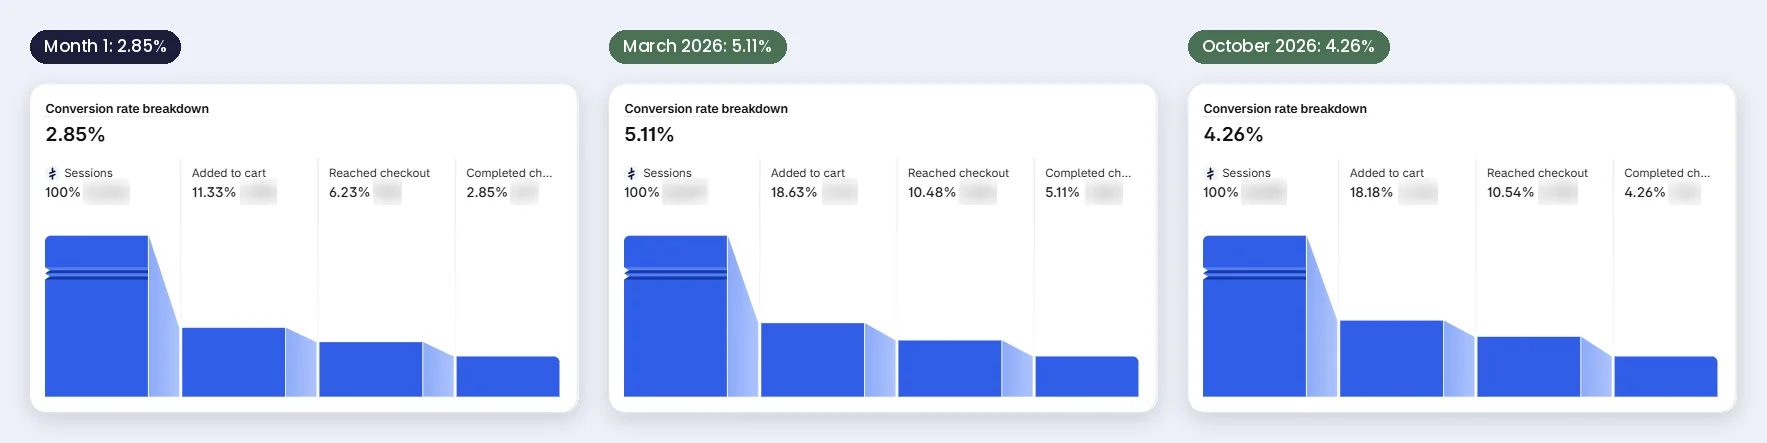
Conversion rate breakdown from Shopify for the same 3 months.
October 2026 was the best month so far: $109,173, a $1.3M a year pace. Add to cart went from 11% of visitors in month 1 to 18%, and it stayed there.
Angela's part and ours
Before the list of what we changed, one thing has to be clear: this is Angela's result as much as ours. We couldn't have done it without the work she puts in.
Angela brings the traffic. She creates content all the time, works with creators, launches new scents almost every week, and she's always the first to say "let's test it": a new email, a new offer, a new idea for the store. She's proactive and very consistent, and she has been for 14 months.
Our job is everything after the click. We make sure the people she brings in buy, and then come back: the website, the product pages, the cart and checkout, the emails and the backend. We fully manage that side so she can keep doing hers.
That's why it works. An owner who keeps bringing people in, and a team that keeps making the store turn more of them into orders. Here's what we did on our side.
The move from SunShop to Shopify
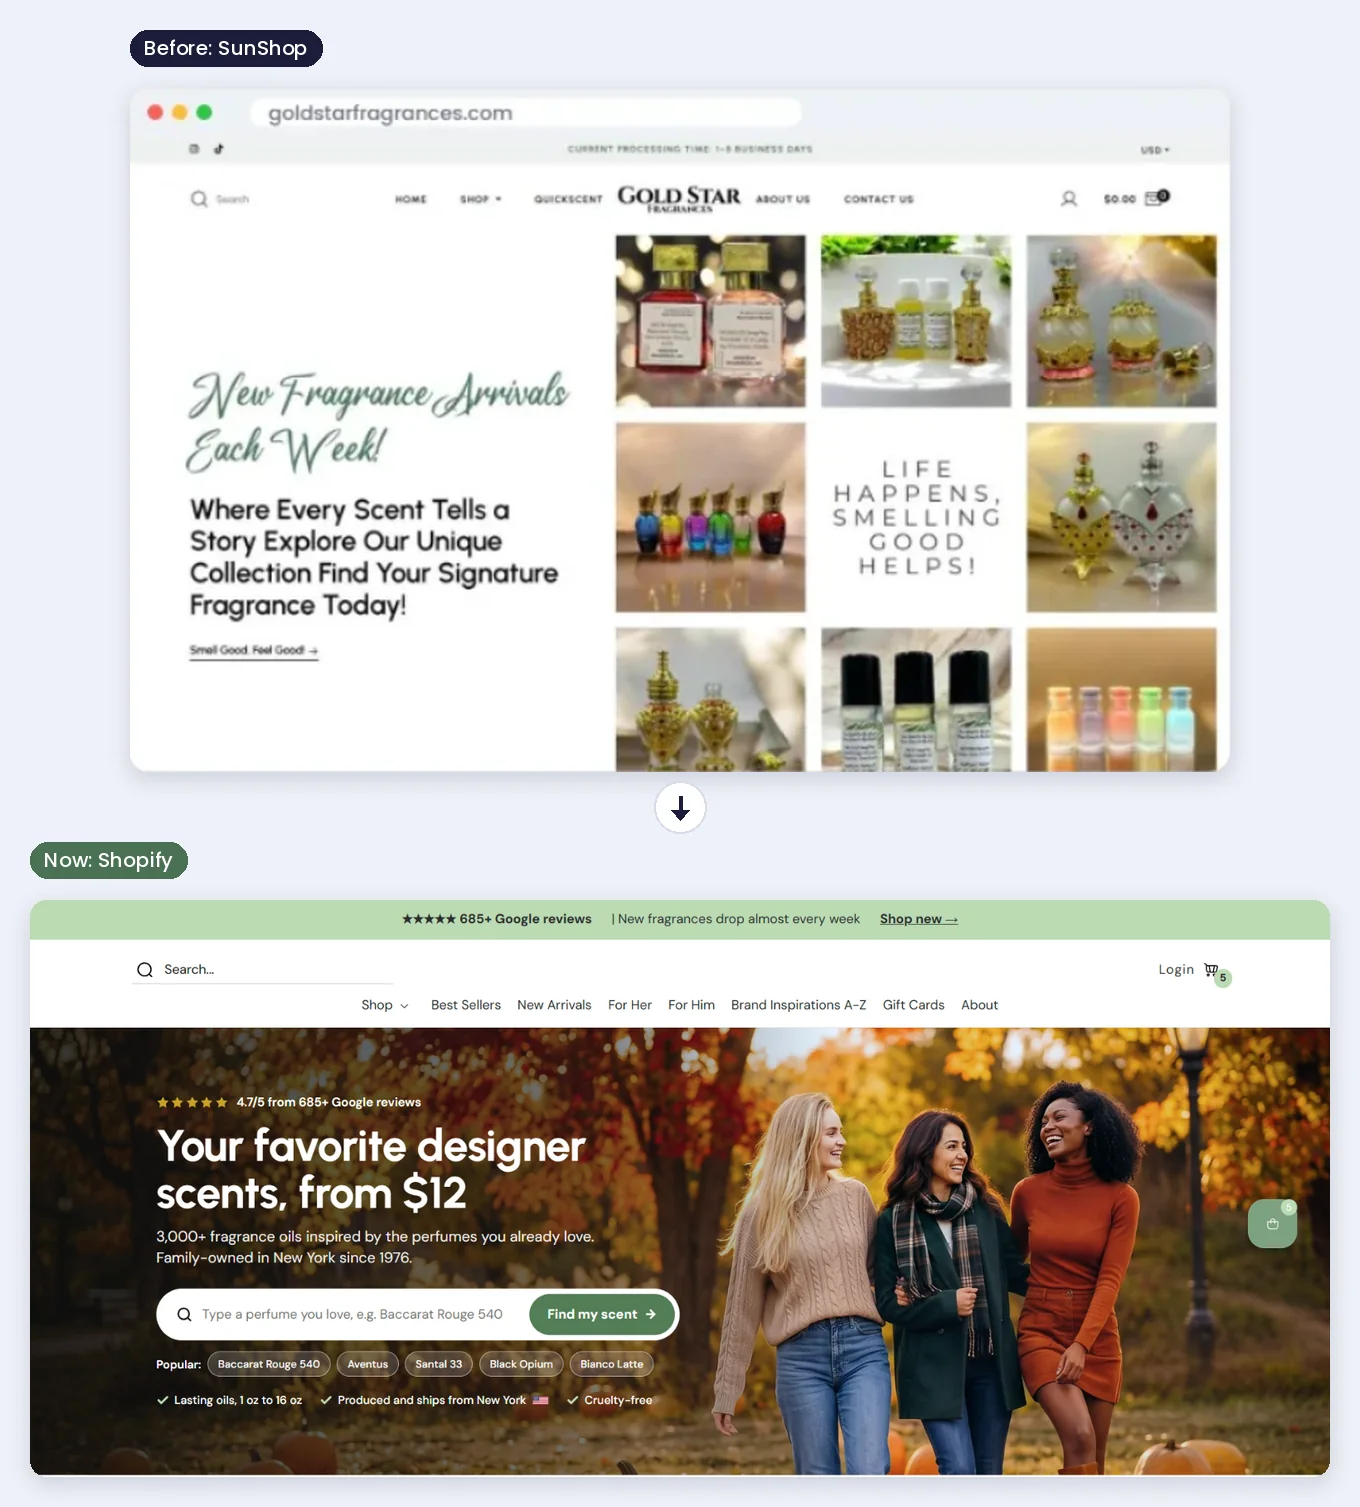
Top: the SunShop homepage. Bottom: the homepage today.
It started with the move. We designed the new store in Figma, moved 2,700 products, the customers and the order history, redirected the old SunShop links so Google kept the traffic, and launched on September 12, 2025. I wrote the full story in the SunShop to Shopify migration case study.
The homepage today answers the first questions right away: "your favorite designer scents, from $12", a search bar that says "type a perfume you love", the most popular scents as buttons (Baccarat Rouge 540, Aventus, Santal 33), 4.7 from 685+ Google reviews and "family-owned in New York since 1976".
18,000 product images, one by one
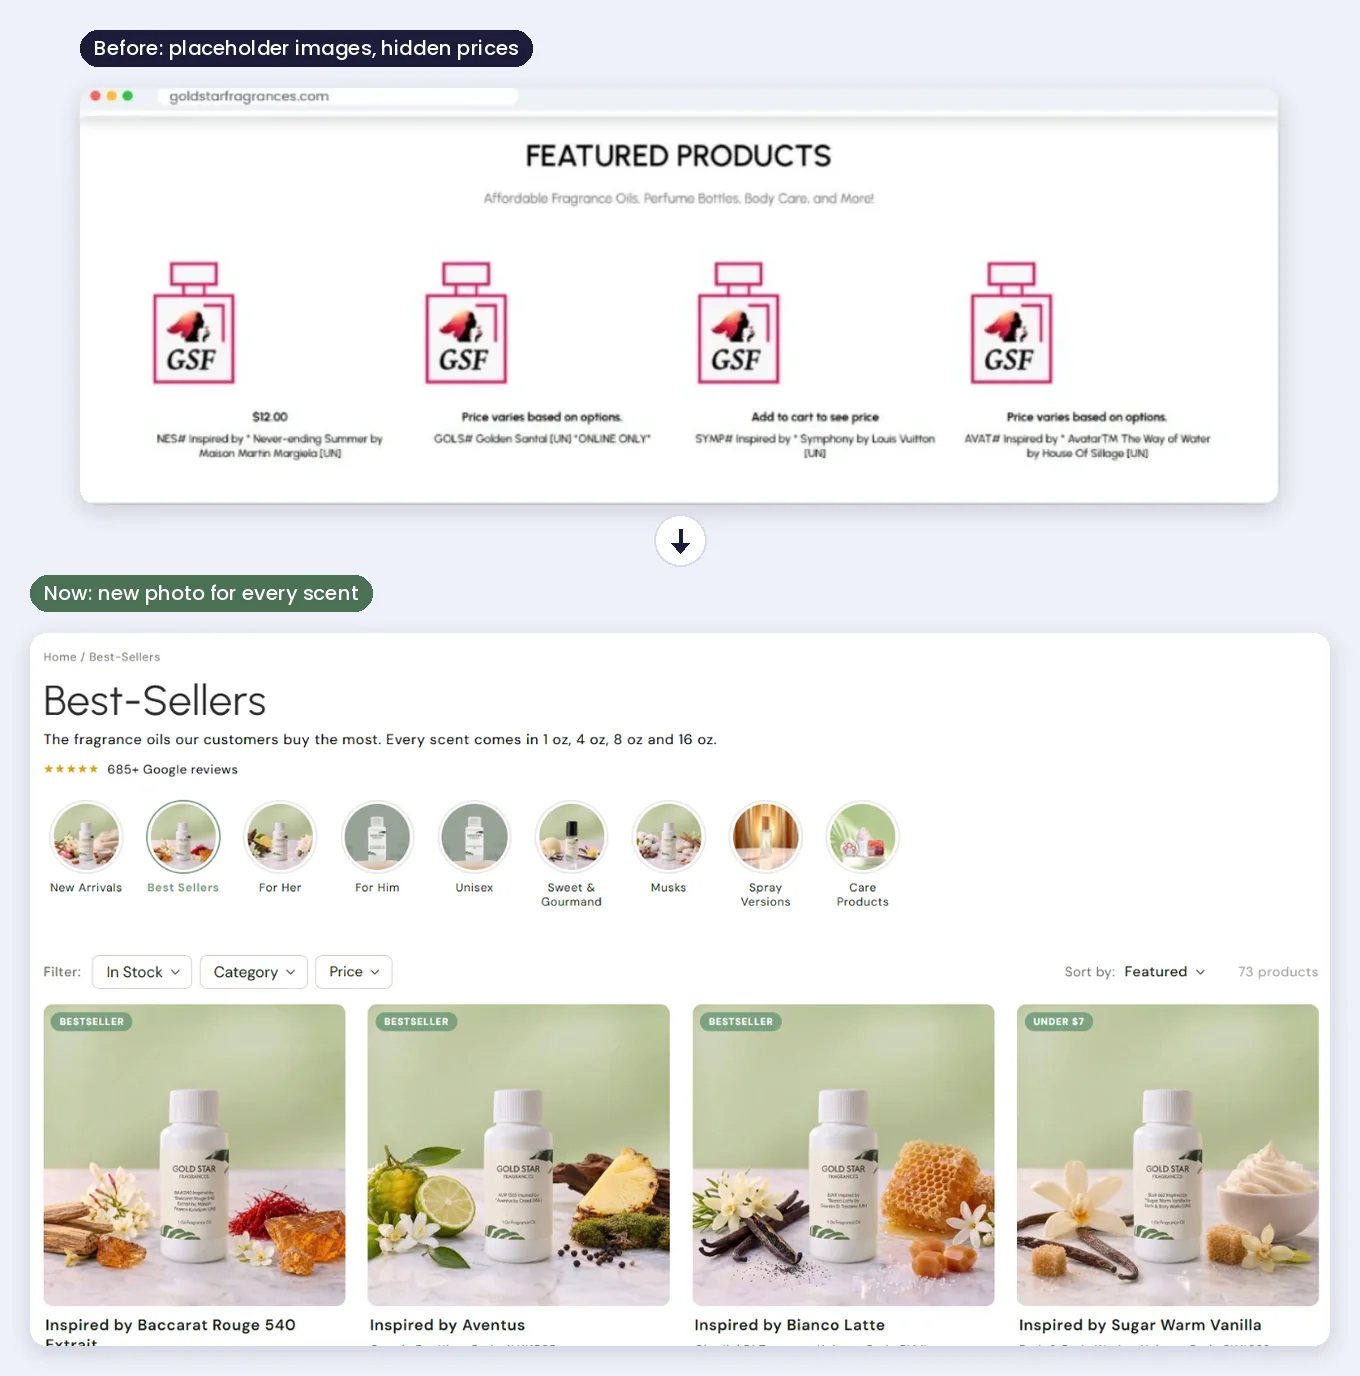
Top: products on SunShop. Bottom: the best sellers page today.
This is the biggest single task on the store, and the one people don't see. Gold Star has 3,000+ scents, each in several sizes and formats, so around 18,000 product images. On SunShop a lot of products had a placeholder bottle and "add to cart to see price".
Mich, our designer, is redoing every one of them in the same style: the bottle on marble, with what the scent smells like around it. Vanilla pods and honeycomb for Bianco Latte, saffron and amber for Baccarat Rouge 540. She works in batches of about 1,900 images, and more than 7,700 are done. A shopper can't smell the oil, so the photo has to do that job.
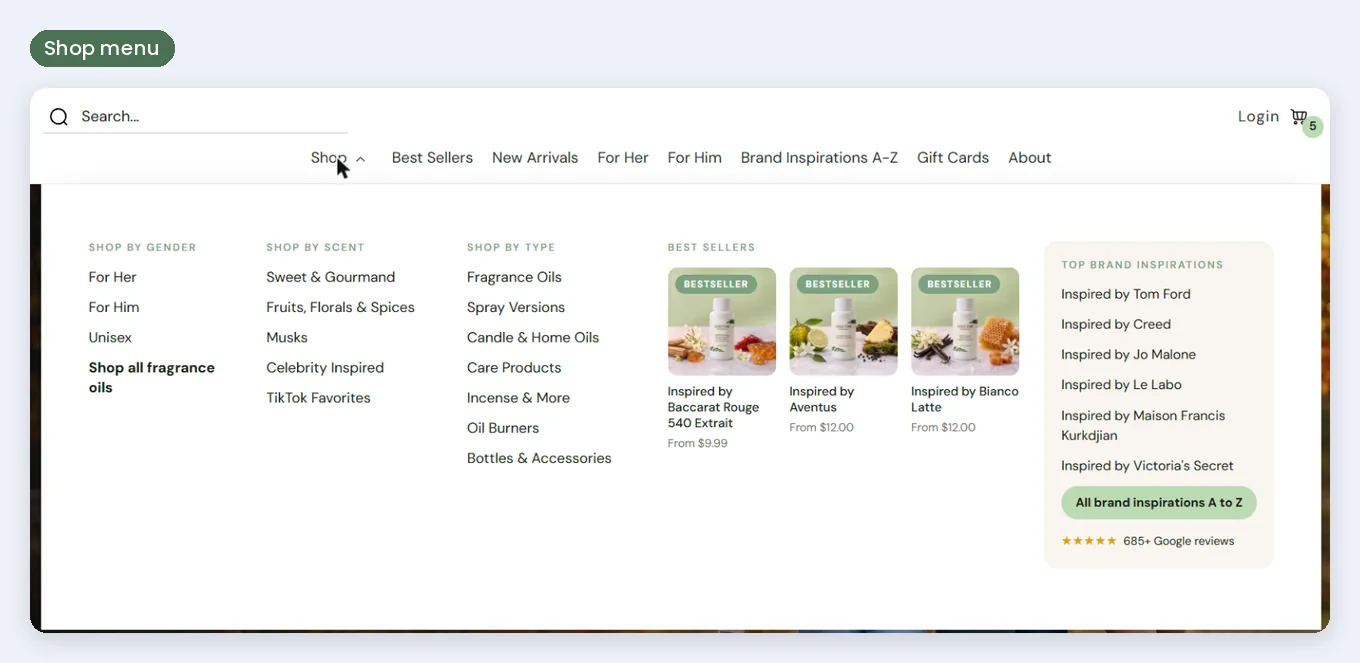
The shop menu on desktop.
People don't look for "a floral oil". They look for the Tom Ford one, or "something like Baccarat Rouge". So the shop menu has the scents by gender, by scent family and by type, the 3 best sellers with photos, and the top brand inspirations with a button to all of them.
Brand Inspirations A-Z: type "tom" or "chan", or jump to a letter.
The Brand Inspirations A-Z page lists 422 designer brands. Type "tom" and you get Tom Ford (47 scents) and the Tommy brands. Click "M" and you jump to Maison Margiela, Marc Jacobs and Michael Kors. Every brand opens its own collection page, so a search like "tom ford perfume dupes" has a page made for it. That's good for shoppers and for Google.
Conversion tests: we design first, then test one change at a time
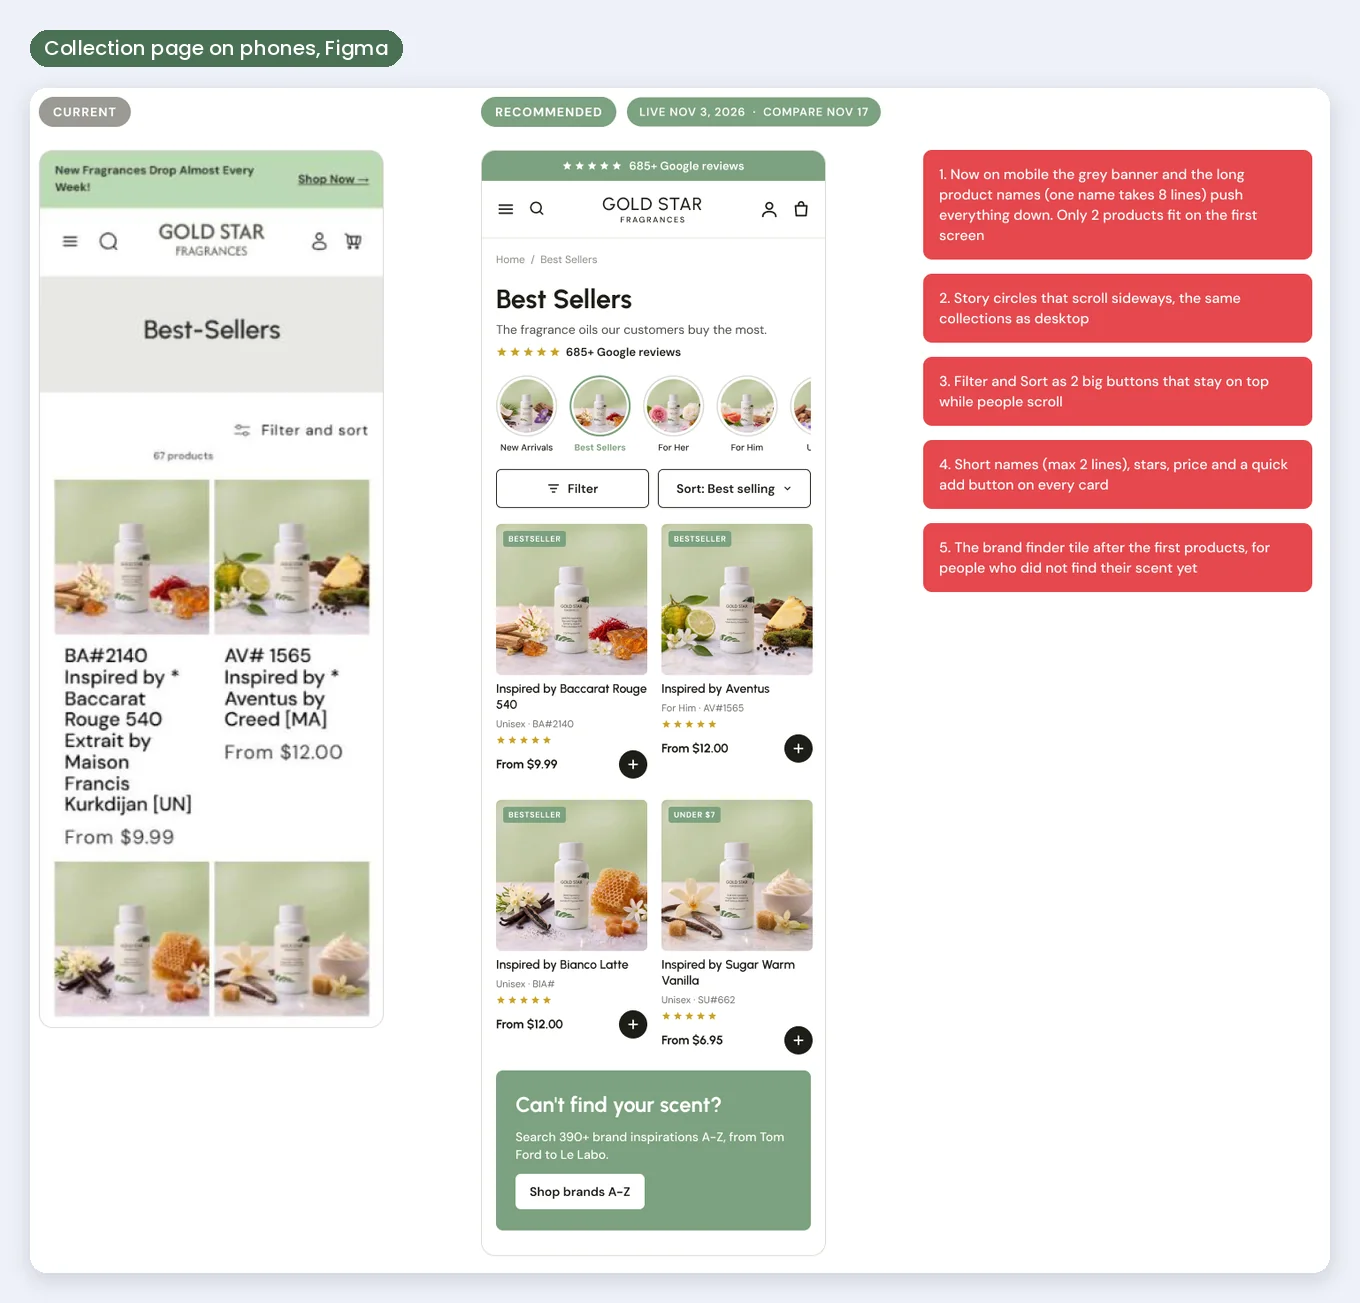
From our Figma file: the collection page on phones, current vs recommended, with the reasons.
Every change starts in Figma: the page as it is, the page as we'd make it, and a note for every change with the reason. On the collection page above, a single product name took 8 lines on a phone ("BA#2140 Inspired by * Baccarat Rouge 540 Extrait by Maison Francis Kurkdijan [UN]"), so only 2 products fit on the first screen. Now names are 2 lines, every card has the stars, the price and a quick add button, and a "can't find your scent?" tile sends people to the brands page.
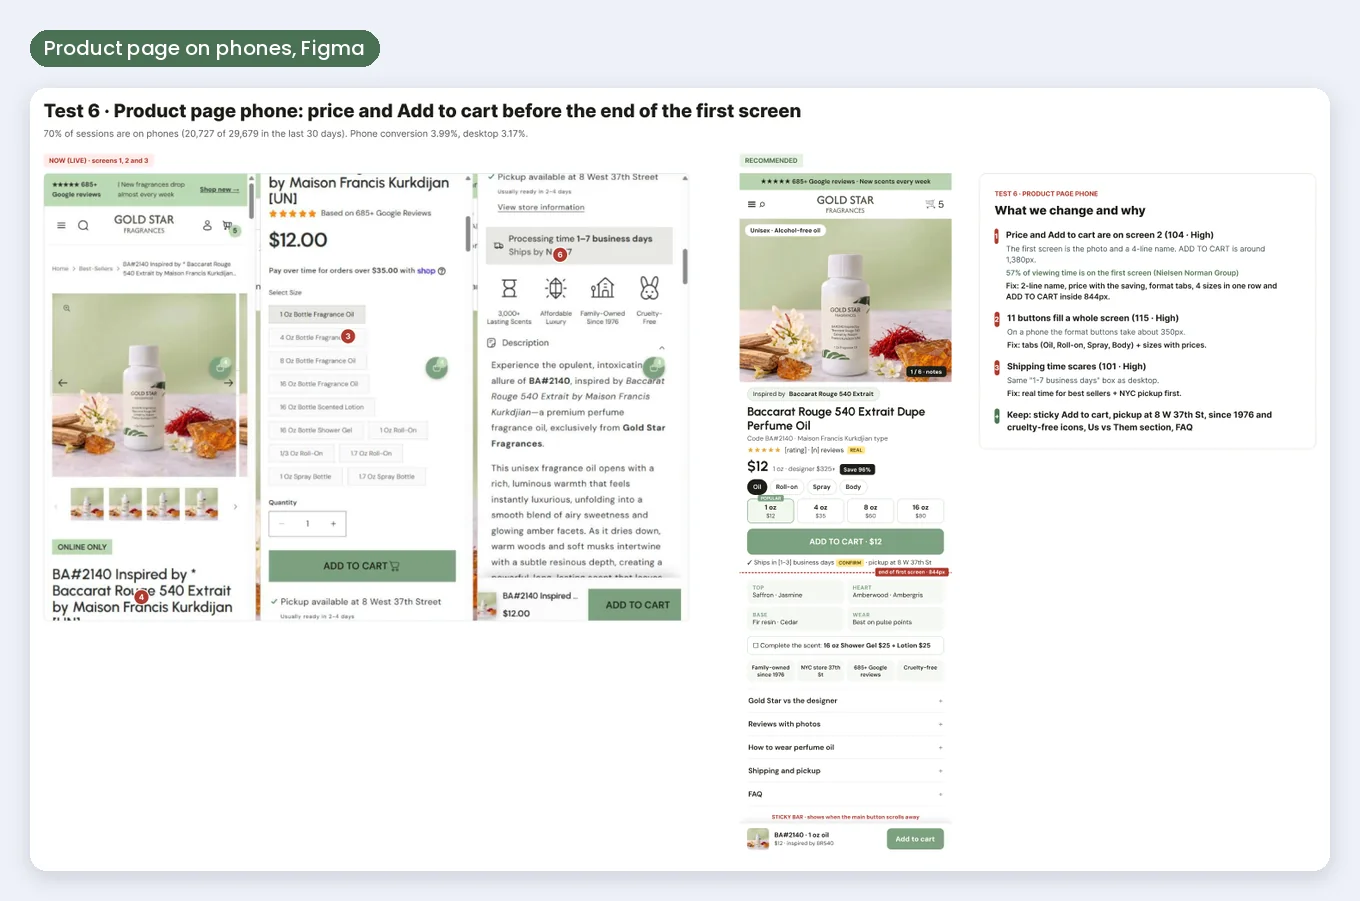
The next test: the product page on phones.
70% of visits are on phones. On the current product page, add to cart sits around 1,380 pixels down, on the second screen. The new design brings the name, the price, the saving vs the designer bottle and add to cart into the first screen.
How we test: one change at a time, then 14 days before vs 14 days after in Shopify analytics, looking at conversion, add to cart and order value. We keep what wins and roll back what doesn't. More on how we do this on our Shopify CRO page.
The cart: offers that bring extra sales
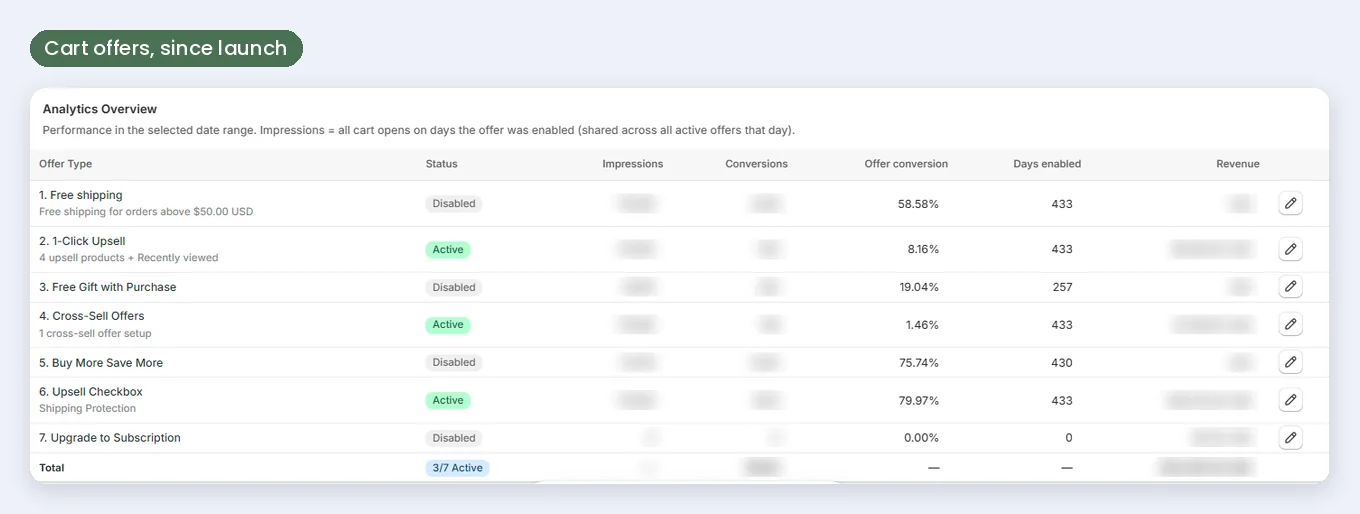
Cart offers since the store moved to Shopify.
Since the move to Shopify, the cart drawer brought:
- Shipping protection: a checkbox in the cart, and 80% of the time people keep it on. It brings the most money of all the cart offers.
- One tap add-ons: best sellers and the scents they just looked at (recently viewed), added with one tap.
- Cross-sell: a matching product shown next to what is already in the cart.
- Free shipping bar at $50: it shows how much is left for free shipping, so people add one more item.
All of this is extra money that comes only from the cart. I wrote more about this in how we raise AOV on Shopify and in how to optimize your Shopify cart and checkout.
The checkout
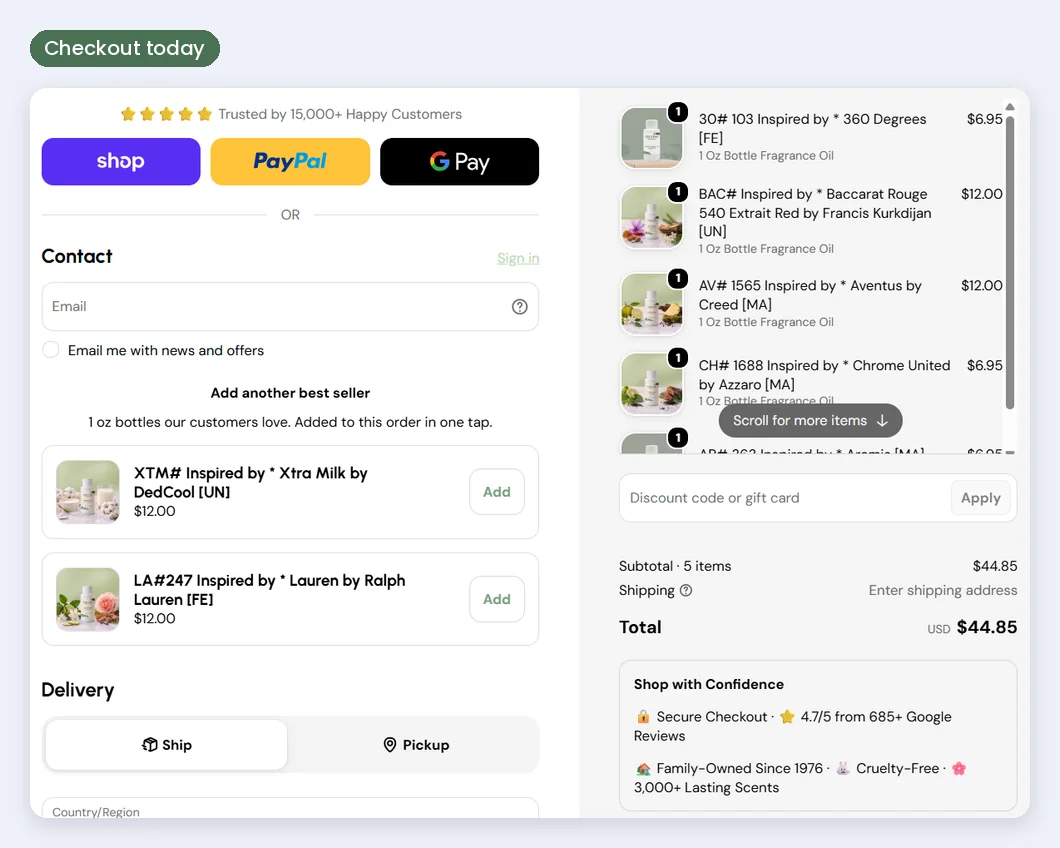
The checkout today.
Gold Star is on a Shopify Plus trial, which lets us change the checkout. On October 31 we added:
- "Add another best seller": 1 oz best sellers that go into the order in one tap
- a "Shop with Confidence" box under the total: 4.7 from 685+ Google reviews, family-owned since 1976, cruelty-free
- Ship or Pickup at the New York store, right at the top of delivery
Before we started, 37% of the people who reached checkout finished the order. We check it again after Black Friday, and if Plus doesn't pay for itself, Angela keeps the offers that work on a normal plan.
Emails: 43% of sales in 90 days
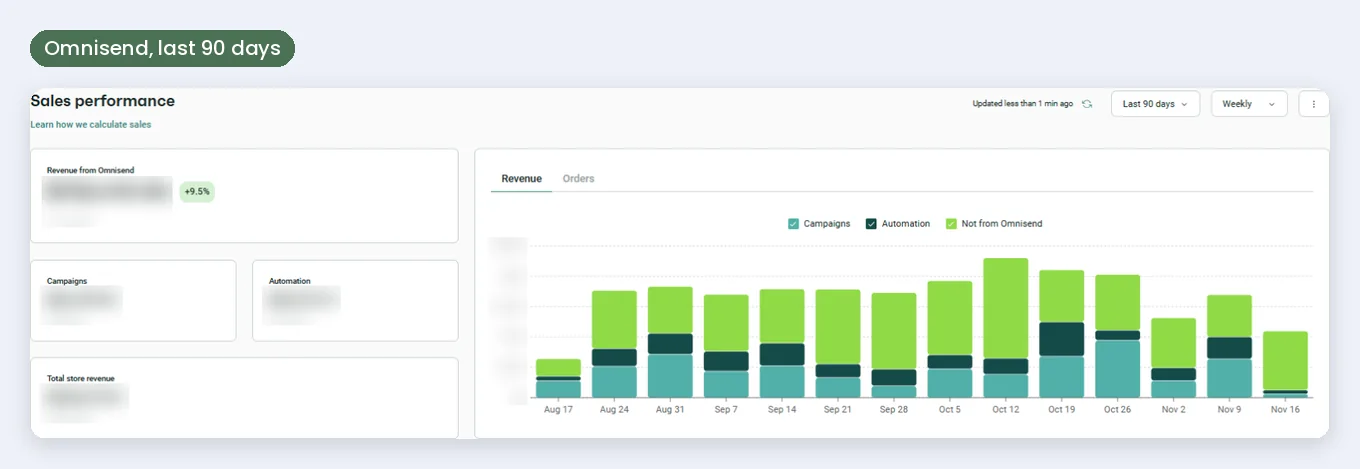
Omnisend, last 90 days.
In the last 90 days, emails brought 43% of the store's sales. Campaigns brought almost two thirds of it, automations the rest.
Angela is very consistent with emails. She always has a new idea, a new scent or an offer to send, and she's happy to test. Our job was to make every email work harder.
The first thing we did was warm up their list. We stopped sending to contacts who hadn't opened in a long time and focused on the people who still read, so more emails land in the inbox. Open rates went from 15 to 18% (November to January) to 30 to 33% (August to October). Then came a lot of email marketing: about 4 campaigns a week with Angela, on templates we designed, plus automations that run on their own.
We didn't start by designing emails. We started with an audit of every campaign: 207 emails sent from November 2025 to October 2026, ranked by opens, clicks and money.
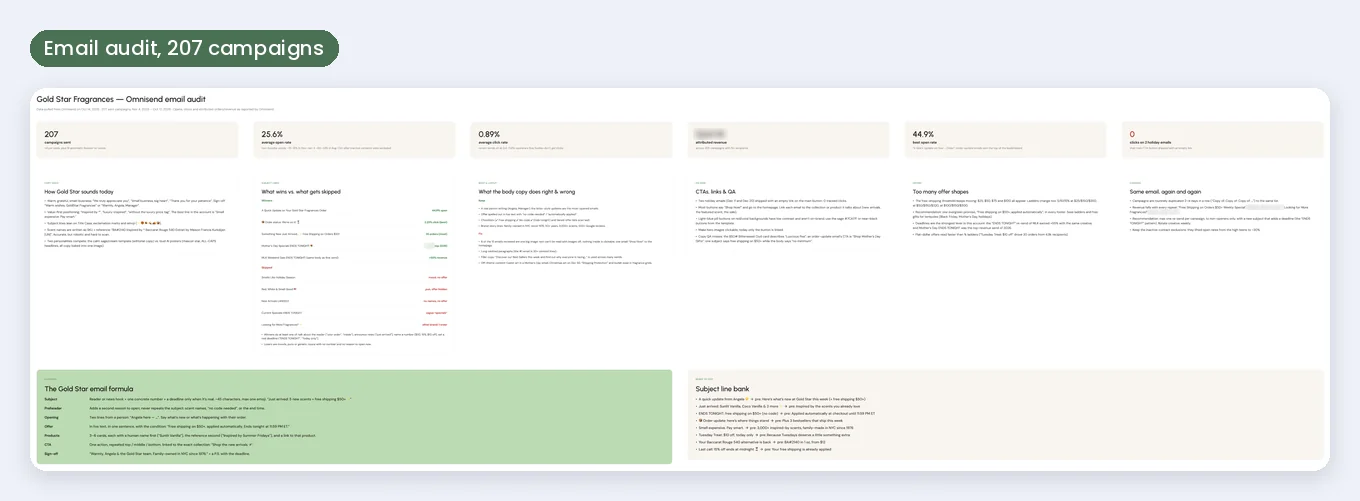
The email audit board in Figma.
What we found:
- Average open rate 25.6%, average click rate 0.89%.
- The best emails sounded like a person: "A Quick Update on Your Gold Star Fragrances Order" opened at 44.9%.
- 2 holiday emails had a broken button and got 0 clicks.
- Too many offer shapes ($25, $50, $75 and $100 thresholds), so nothing stuck.
- The same email sent again and again, with less money from each repeat.
From that we wrote one formula for every email (subject, first lines, one offer, 3 to 6 scents, one button, signed by Angela), a bank of subject lines to test, and new templates in the Gold Star look.
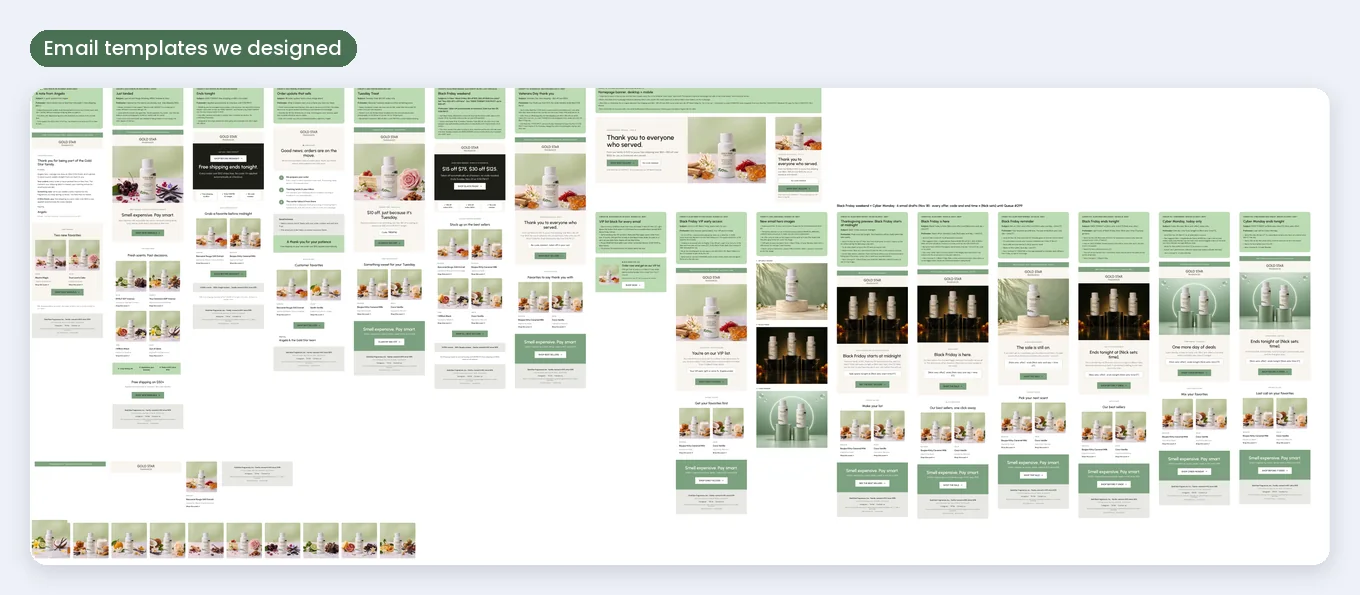
Part of the email board: templates, Veterans Day and the Black Friday to Cyber Monday emails.
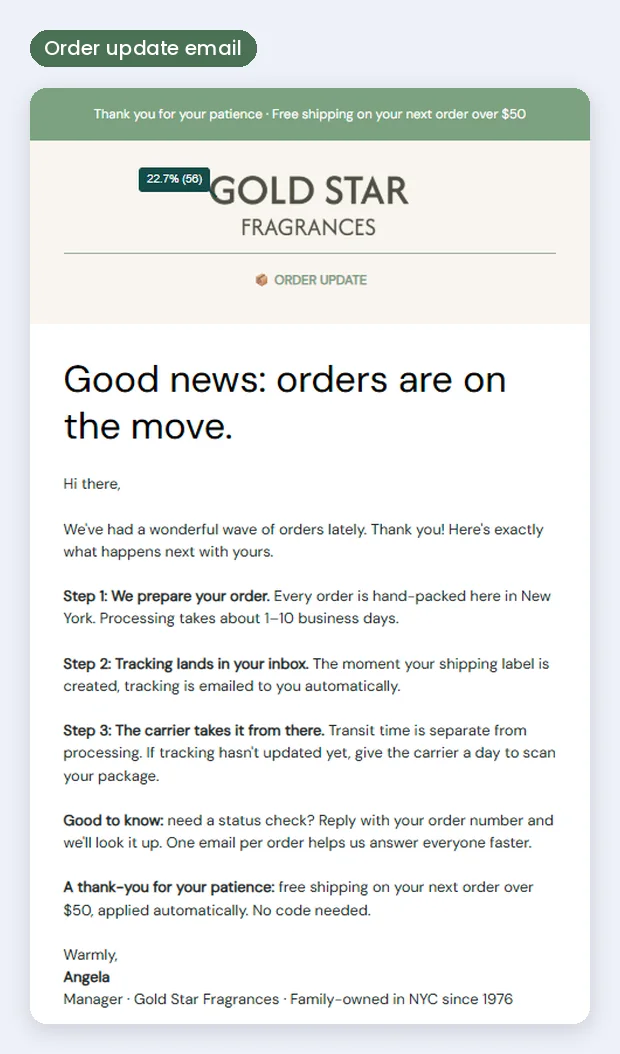
The order update email: 43.3% opened it, and it brought 28 orders.
Two examples. When orders took longer to ship, we sent an "order update" email that explains the 3 steps of an order and gives free shipping on the next order over $50: 43.3% opened it and it brought 28 orders. A "Tuesday Treat" email on October 27 brought 22 orders in one send.
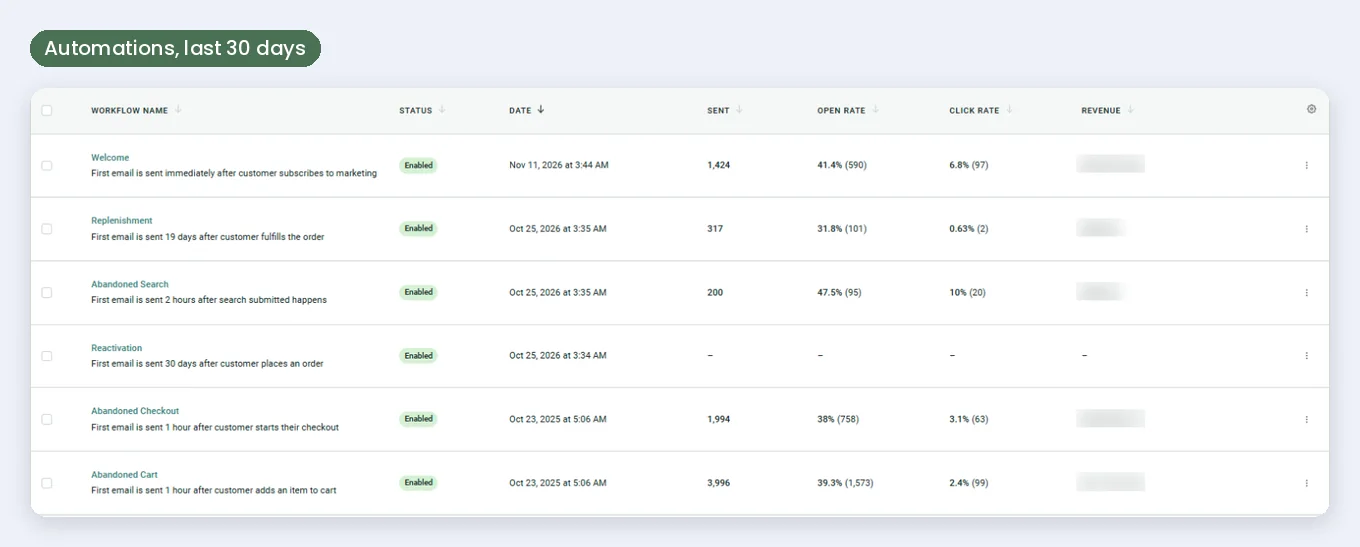
Automations in the last 30 days.
The automations run on their own: in the last 30 days abandoned cart brought the most, then abandoned checkout and the welcome flow. The plan for the next weeks: rebuild cart and checkout in the Gold Star look, add browse abandonment, and a win back flow for 5,103 customers who haven't ordered in a while.
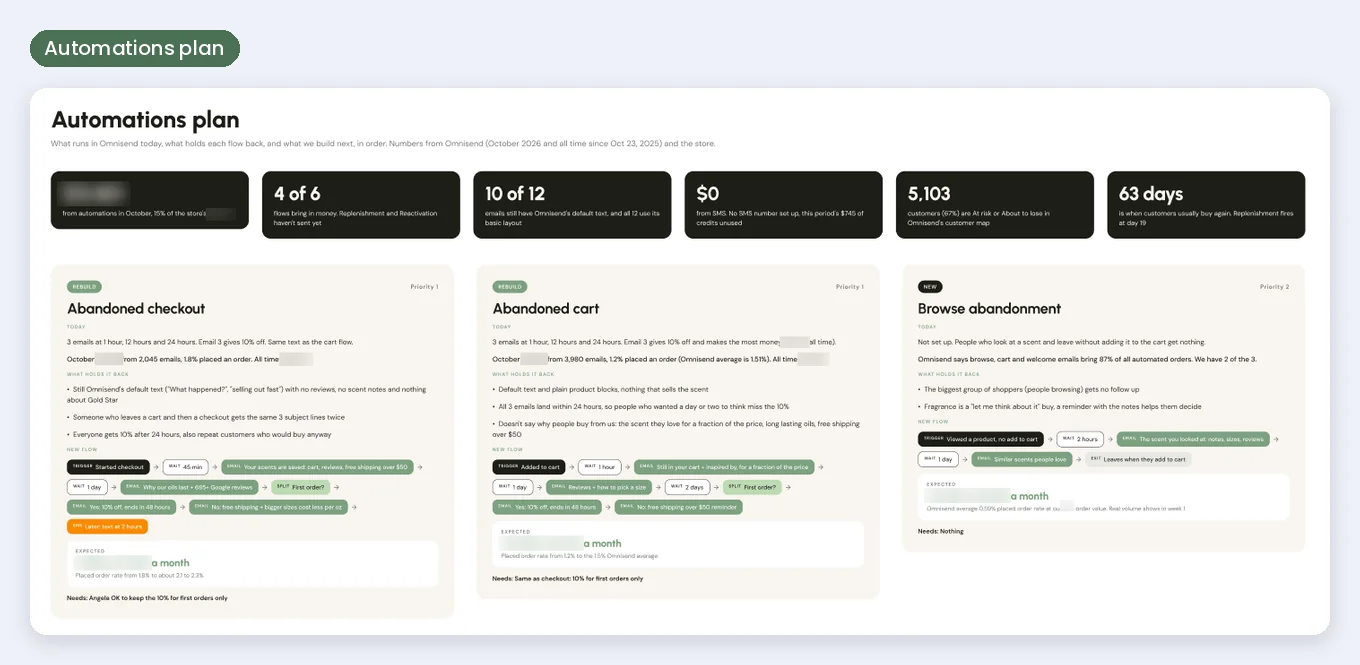
The automations plan, flow by flow.
If you're on Klaviyo and wondering about Omnisend, read how we move stores from Klaviyo to Omnisend.
Google traffic
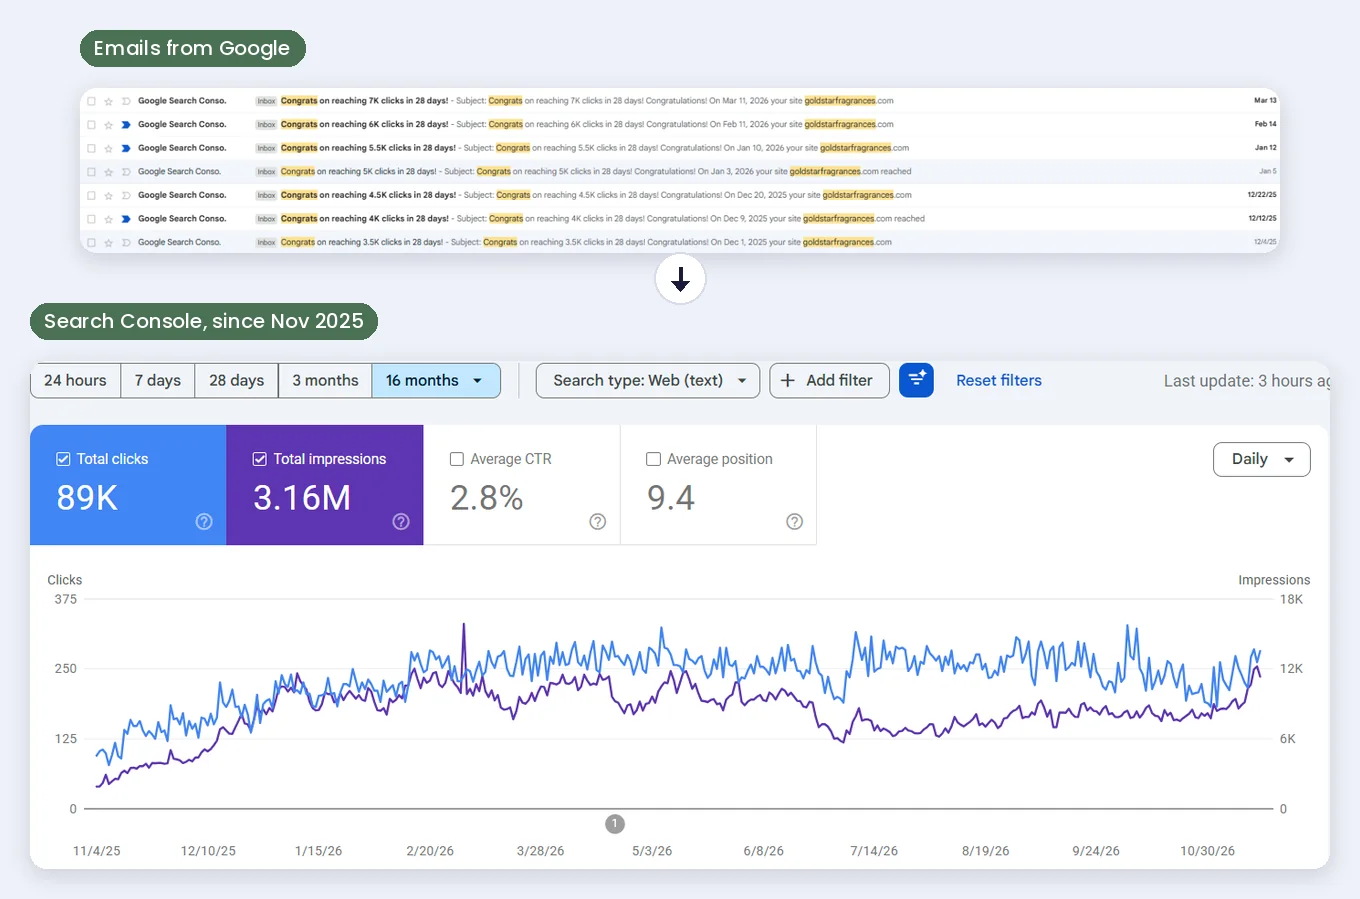
The "congrats" emails from Google and Search Console since November 2025.
Google sends an email every time a site reaches a new level of clicks. For Gold Star they kept coming: 3,500 clicks in 28 days on December 1, 2025, then 4,000, 4,500, 5,000, 5,500, 6,000 and 7,000 clicks in 28 days by March 11, 2026. Since November 2025 the store got 89,000 clicks and 3.16 million impressions from Google, and clicks went from about 100 a day to about 250 a day.
The store was built for Google from the first day: every old SunShop link redirected, a collection for every brand, and the A-Z page linking to all of them. Since spring, clicks have stayed around 8,000 a month, so now we do their SEO every month, starting with a real "dupes" page for each big designer brand, the kind of page that wins searches like "bond no 9 dupes".
Monthly SEO for your Shopify store
The same SEO we do for Gold Star: buyer pages first, then guides, a 4 month plan in a shared Google Sheet and a report every month with Google clicks, rankings, orders and revenue. Plans start at $350 a month.
The affiliate program: 123 creators selling
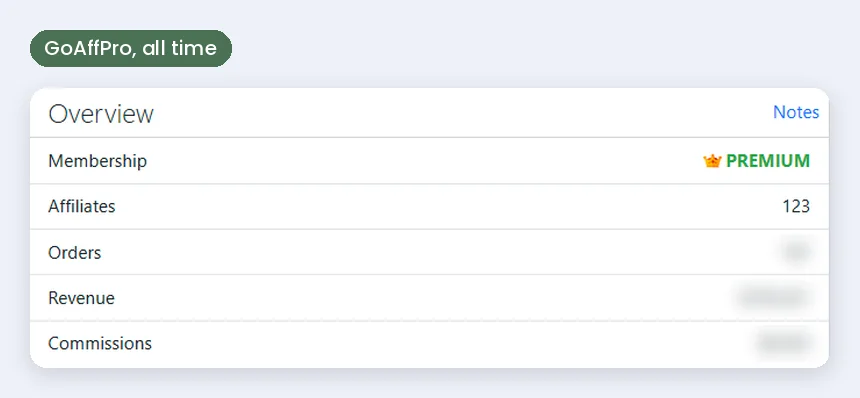
GoAffPro, all time.
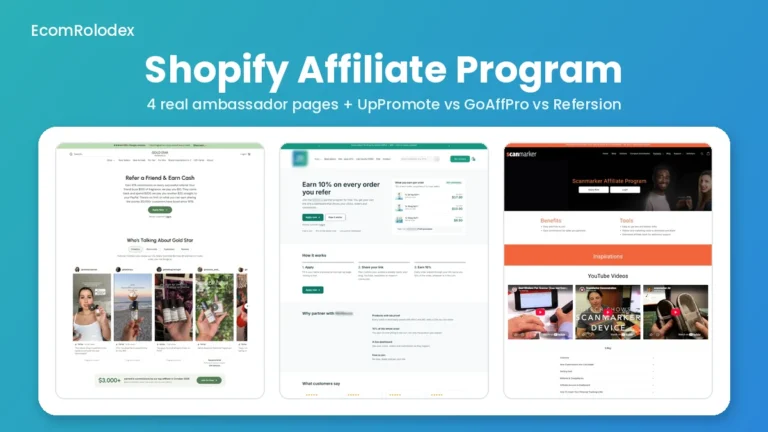
Perfume sells through people. Gold Star's affiliates are creators who show the bottle and say how it smells. We set up GoAffPro and built the ambassador page inside the store, with the payout written in dollars. So far 123 affiliates have joined, and they bring sales every month.
I wrote how to set one up, with the Gold Star page as one of the examples, in how to start a Shopify affiliate program.
Meta ads: we only trust Shopify's numbers
This is the part most agencies won't show you.
When we checked the ads that ran before November, Meta said the ads brought 153 purchases since September 23. Shopify showed 17 orders that came from an ad click. Meta also counts people who saw an ad and bought later from Google or an email, so its numbers look much better than what the ads really did.
So now we judge the ads only on Shopify orders, and we send Angela a report every Monday. The first 5 days with 5 new image ads (November 14 to 18):
- Meta says 27 purchases. Shopify shows 6 orders that came from the ads, 5 of them new customers.
- That's $1.94 back for every $1 spent, vs 25 to 46 cents before
- A click costs about $0.70, it was over $2
- The best ad brought 4 orders on its own
It's 5 days, so it's early. But now every decision about the budget is based on real orders.
What didn't work
Not everything works, and I'd rather you hear it from me:
- The quiz funnel. In September, cold traffic from Facebook went to a quiz funnel. 1,909 visits, 8 orders. That's 0.4%, while the store converts around 4%. Next test: send the same traffic straight to the best sellers.
- Trusting Meta's numbers. See above. Weeks of ad money were judged on purchases that weren't really from the ads.
- Too many email offers. $25, $50, $75 and $100 thresholds in different weeks made the offers hard to remember. Now it's one simple offer at a time.
How we work with Gold Star every month
Angela runs the brand: the content, the creators, the new scents and a steady flow of ideas to test. We fully manage the website and the backend, and we talk on WhatsApp. Behind it there's a devsheet with every task, its time and its status, and a Figma file with every design, test and email. Our designers do the designs and the images, our developers code them into the theme, and I lead the strategy and the conversion work.
A normal month has a bit of everything: new pages, product page fixes, a speed job, emails for the next sale, an SEO plan, the ads report. That's why it works. The store, the emails, the ads and Google all point the same way, because one team looks at all of it.
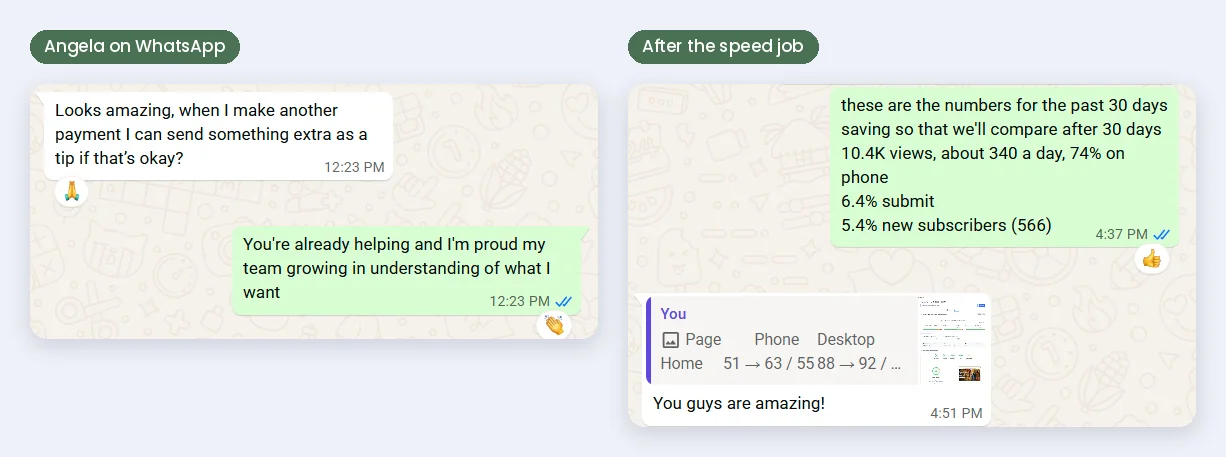
Two real messages from Angela on WhatsApp.
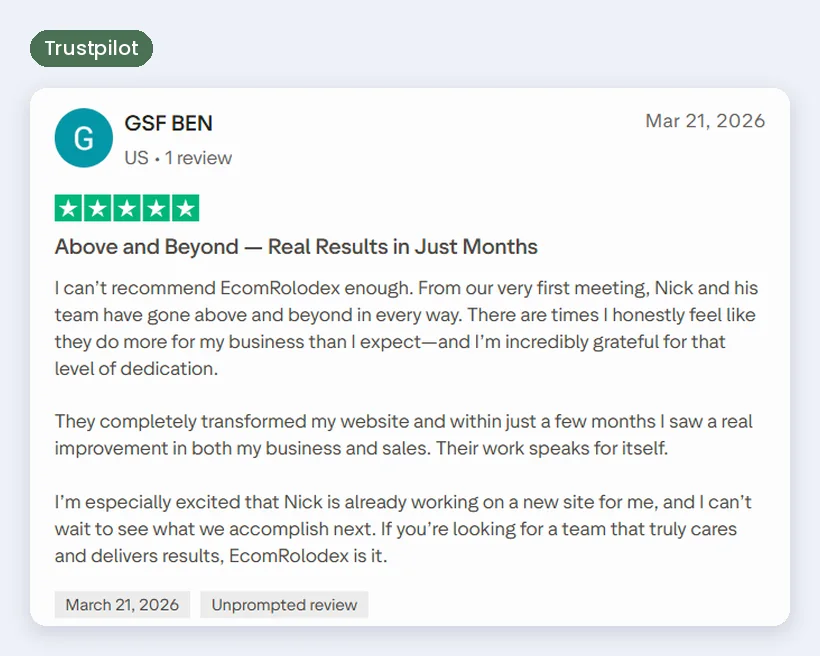
Gold Star's review on Trustpilot.
The "new site" in that review is Scent Bar by Angela, the second store we built for the same family.
Is this kind of work right for your store?
This works best for stores that already sell, at least a few hundred orders a month, and want one team to grow it instead of 4 freelancers who don't talk to each other. If that's you, I'd look at your store, your analytics and your emails, and tell you what I'd do first and what it would cost.
If you're earlier than that, start with the $49 store review, or the free Store Analyzer.
Questions
How long did it take Gold Star to reach $1M on Shopify?
14 months. The store moved to Shopify on September 12, 2025 and passed $1M in sales by November 18, 2026.
What made the biggest difference?
Angela. She never stops bringing traffic and testing new ideas. On our side, the biggest one was email marketing. We warmed up their list (open rates went from under 20% to about 30%), then sent a lot of emails that sound like Angela, and now emails bring 43% of the store's sales. The next one is SEO: we now do their SEO every month, so more people find the store on Google without paying for ads. It's the same work we offer in our monthly SEO packages. After that, the new product images and the cart offers.
Do you only work on Shopify?
Yes. If your store is on another platform, we move it first, like we did with Gold Star. See our Shopify migration service.
How much does it cost to work with you every month?
It depends on how many hours a month the store needs. Our monthly plans are on the packages page. On a call I'll tell you which one fits and what I'd do in the first month.
Can I see the store?
Yes, it's live at goldstarfragrances.com.
Want to scale your store like this?
Book a call. I'll look at your store before we talk and tell you what I'd do first.
Not ready to talk yet? Run your store through the free Store Analyzer and get 20+ tips in about 30 seconds.