


The average Shopify conversion rate sits somewhere between 1.4% and 2.66%, depending on whose data you read. From what I see on the stores we work on, a good Shopify store converts at 3% or more, and our best stores run at 4% to 5%.
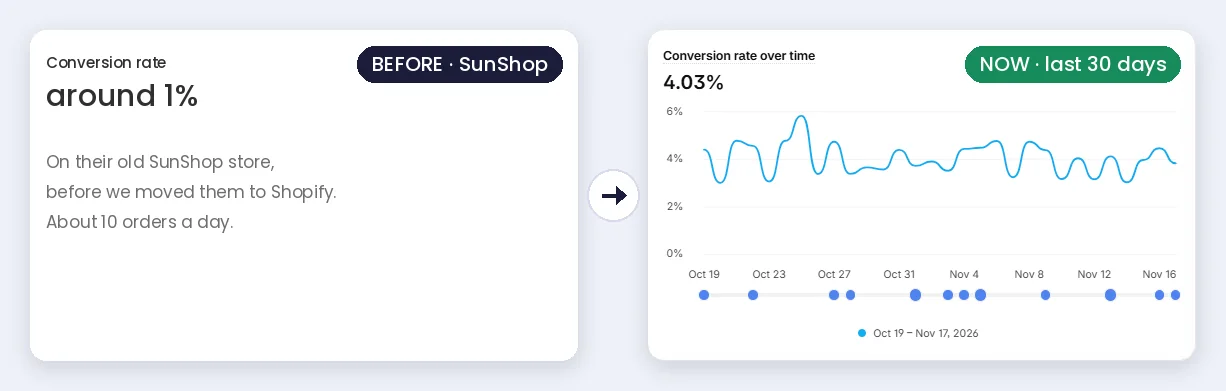
GoldStar Fragrances: around 1% on their old SunShop store, 4.03% on Shopify from Oct 19 to Nov 17, 2026 (Shopify analytics).
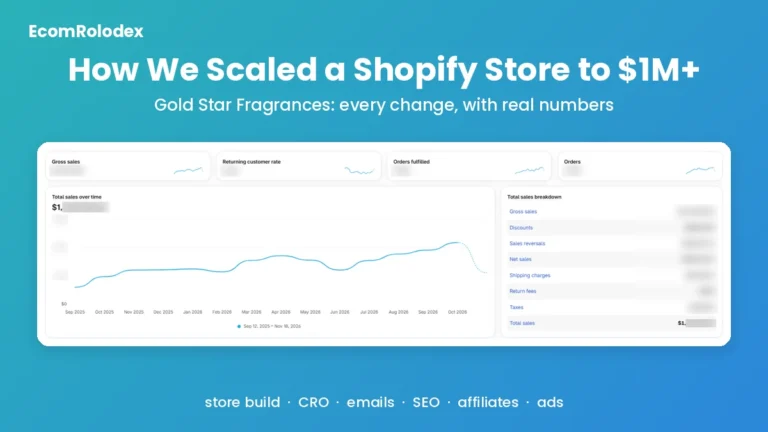
That screenshot is from GoldStar Fragrances, a fragrance oil store in New York. Their old SunShop store converted around 1% and did about 10 orders a day. We moved them to Shopify and have worked on the store every month since. Today they do 30 to 50 orders a day, and from October 2025 to October 2026, 4.53% of their 241,000+ sessions ended in an order.
I'm Nick Ursu. I've worked only on Shopify for 9+ years, and my team has done 1,300+ Shopify projects since 2017. Below you'll find the benchmark numbers with their sources, the real before and after numbers from our clients, how Shopify counts your rate, why it sometimes looks wrong, and the order we fix things in when we want it to go up.
Bonus: want to see where your own store loses buyers? Run it through our free Store Analyzer. It checks your theme, apps, speed, reviews, cart, product page and SEO, and gives you 20+ tips in about 30 seconds.
Quick overview
- Average for ecommerce: 1.4% of visits bought in Q1 2026 (Statista) and 2.66% across 400+ brands (Dynamic Yield), both quoted in Shopify's own guide
- Desktop vs phone: 3.7% on desktop, 2% on mobile (Contentsquare retail data)
- By niche: from 0.63% for luxury and jewelry up to 5.7% for pet care (Dynamic Yield)
- Our clients after the work: GoldStar 4.03%, IceBathTubs 3.11%, a Sydney home and garden store 6%
- What moves it first: the product page on a phone, reviews, the cart, speed, then emails
The average Shopify conversion rate in 2026 (with sources)
Shopify doesn't publish one official average for all Shopify stores. Shopify's own guide to ecommerce conversion rate (updated in August 2026) quotes two numbers:
- Statista: 1.4% of global ecommerce visits turned into a purchase in Q1 2026.
- Dynamic Yield, which benchmarks more than 400 brands: 2.66%.
The gap between those two is the first lesson. Statista counts ecommerce visits everywhere. Dynamic Yield's number comes from the brands it benchmarks. So read 1.4% as the wide average and 2.66% as the average of a smaller group of brands, and expect your own number to land somewhere around them.
Conversion rate by niche
Your niche moves the number more than anything else. Here is Dynamic Yield's June 2026 benchmark from the same Shopify guide, next to what we see on stores we've worked on in that niche:
| Niche | Average (Dynamic Yield) | Our stores in that niche |
|---|---|---|
| Pet care | 5.7% | - |
| Beauty and personal care | 5.32% | GoldStar (fragrance oils): around 1% before, 4.03% now |
| Food and beverage | 4.58% | - |
| Fashion and apparel | 2.77% | - |
| Consumer goods | 1.76% | - |
| Home and furniture | 1.29% | A home and garden store in Sydney: 3% before our redesign, 6% after |
| Luxury and jewelry | 0.63% | - |
| High ticket wellness (not in their list) | - | IceBathTubs: 0.71% before, 3.11% six months after |
Two things to notice. First, the same Shopify page gives different numbers for some niches in its FAQ (5.29% for food, 0.94% for luxury). Benchmarks move a lot from one report to the next, so use them as a rough range, not a target.
Second, a niche average can fool you in both directions. GoldStar sells fragrance oils, which sit under beauty, where the average is 5.32%. They started near 1% and now run around 4% to 5%. Our home and garden client was already at 3% when they came to us, more than double their niche average, and a redesign still took them to 6%. Being above average doesn't mean there's nothing left.
So what is a good conversion rate for a Shopify store?
When a store owner sends me their store and their number, this is how I read it:
| Your conversion rate | How I read it |
|---|---|
| Under 1% | Something is broken, or the traffic is wrong. I check bots, tracking and the product page on a phone before anything else. |
| 1% to 2% | Normal for a lot of stores. There is room to grow, usually on the product page and in the cart. |
| 2% to 3% | Good. Now the small things start to matter: reviews, a delivery date near the button, the free shipping line. |
| 3% and up | Very good for most niches. The best stores we work on sit between 4% and 5%. |
Two exceptions. High ticket stores convert lower, because people think longer before they buy an ice bath than a lip balm. IceBathTubs, an ice bath and sauna brand in Auckland, was at 0.71% before we started. And stores that live on returning customers and email usually convert higher than stores that live on cold ads. Compare yourself to stores like yours, and to your own last 90 days.
Real conversion rates from our clients (before and after)
These numbers come from our clients' own Shopify analytics. Where we don't have the owner's OK to use their name, I describe the store instead.
| Store | Before | After | What we changed |
|---|---|---|---|
| GoldStar Fragrances, fragrance oils, New York | Around 1% on SunShop | 4.03% (last 30 days), 4.53% over 12 months | Moved to Shopify in about 6 weeks, every page built for mobile, then monthly work on photos, the cart, the popup and emails |
| IceBathTubs, ice baths and saunas, Auckland | 0.71% (3 months before) | Up 59% in the first 3 months, 3.11% six months after | New product page and mobile menu, new product images, bundles |
| More Than Lips, vegan lip balm, Toronto | - | Up 54% in 90 days | Cart optimization and CRO |
| A home and garden store, Sydney | 3% | 6% | Redesign |
| A store with $237 average orders | 2.66% | 5.02% in 3 months (same 14,900 visitors, orders 422 to 798) | Redesign focused on conversion |
| An education store, Texas | Under 1% (90 days before) | Up 242% in the first 7 days | Redesign of the main pages |
| A small organic skincare store, Canada | 0.59% (90 days before) | 3.02% (first 11 days) | New popup and welcome and abandoned cart emails, product page and cart fixes, 12 paid hours |
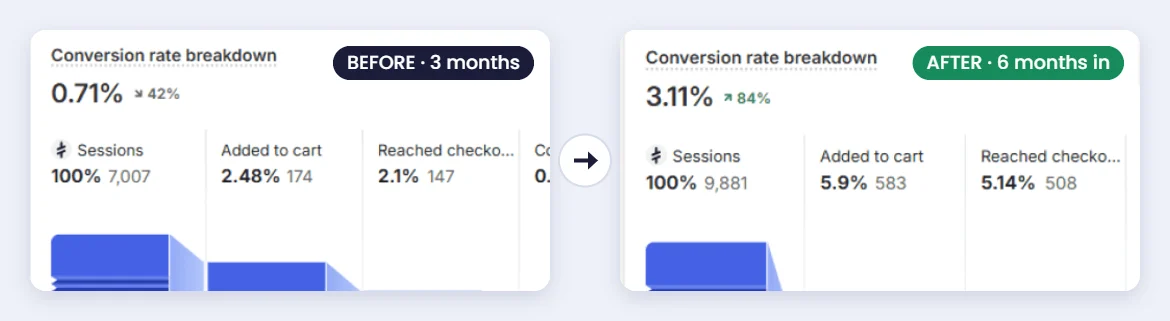
IceBathTubs: 0.71% in the 3 months before we started, 3.11% six months after launch. Add to cart went from 2.48% to 5.9%. Read the IceBathTubs story
Look at the last column. None of these came from one magic app. They came from the product page, the cart, trust and emails, done one at a time and checked against the numbers before the next change.
From our projects: the conversion rate was fine, traffic was the problem
A small organic skincare store in Canada came to us with a 0.59% conversion rate over the last 90 days. In 12 paid hours we moved her emails to Omnisend (popup, 3 welcome emails, 3 abandoned cart emails) and fixed the product page and cart.
About a week later she told us she didn't see a difference. The numbers said otherwise. Over the first 11 days: 3.02% conversion and 11 orders, as many as in the 30 days before. So I told her straight: the store works now, traffic is your problem.
A great rate on very few visitors is still very few orders. If your sessions are low, fix the store first, then put your time and money into traffic.
How Shopify calculates your conversion rate
The formula is simple: orders divided by sessions, times 100. A session is one visit. So 40 orders from 1,000 sessions is a 4% conversion rate. Someone who visits on 3 different days and buys once counts as 3 sessions and 1 order.
Where to find it in Shopify
In your Shopify admin, open Analytics. The Conversion rate card shows the number for the dates you pick. Open the conversion rate breakdown to see the 4 steps: sessions, added to cart, reached checkout and completed checkout.
Read the steps, not only the final number
The final number tells you if you have a problem. The steps tell you where it is. Here is GoldStar's breakdown in 3 different months:
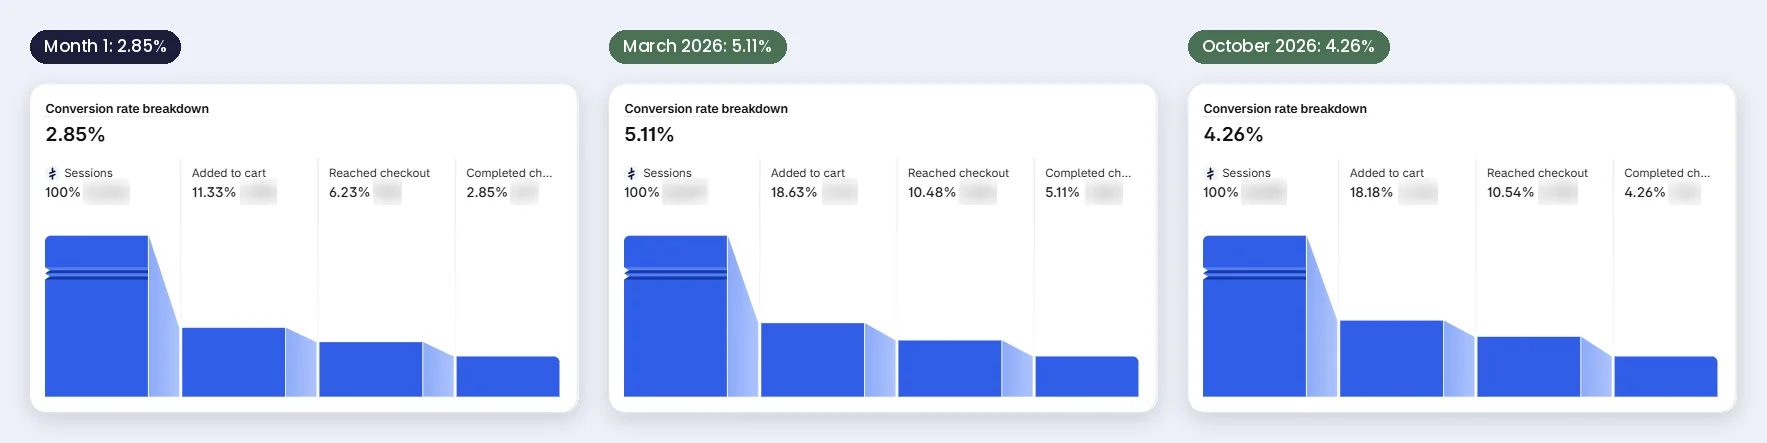
GoldStar's Shopify conversion rate breakdown: 2.85% in the first month on Shopify, 5.11% in March 2026, 4.26% in October 2026. Session counts hidden.
In the first month, 11.33% of sessions added something to the cart and 2.85% bought. By March 2026, 18.63% added to cart and 5.11% bought. In October it was 18.18% and 4.26%. Most of the gain happened before checkout. In all 3 months, between 40% and 49% of the people who reached checkout finished it.
That's why I start with the product page. If your added to cart number is low, no checkout app will save you.
From our projects: how GoldStar got from 2.85% to 5.11%
On SunShop, a lot of GoldStar's products had placeholder images and hidden prices. When we moved them to Shopify we added new product images, put the prices back, and built every page for mobile, because about 8 in 10 of their visitors shop on a phone.
After that it was small changes every month: the cart, the popup, the emails, then the next thing the numbers pointed at. Nothing on its own was big. Over those months, added to cart went from 11% to over 18%. The full story is in the GoldStar case study.
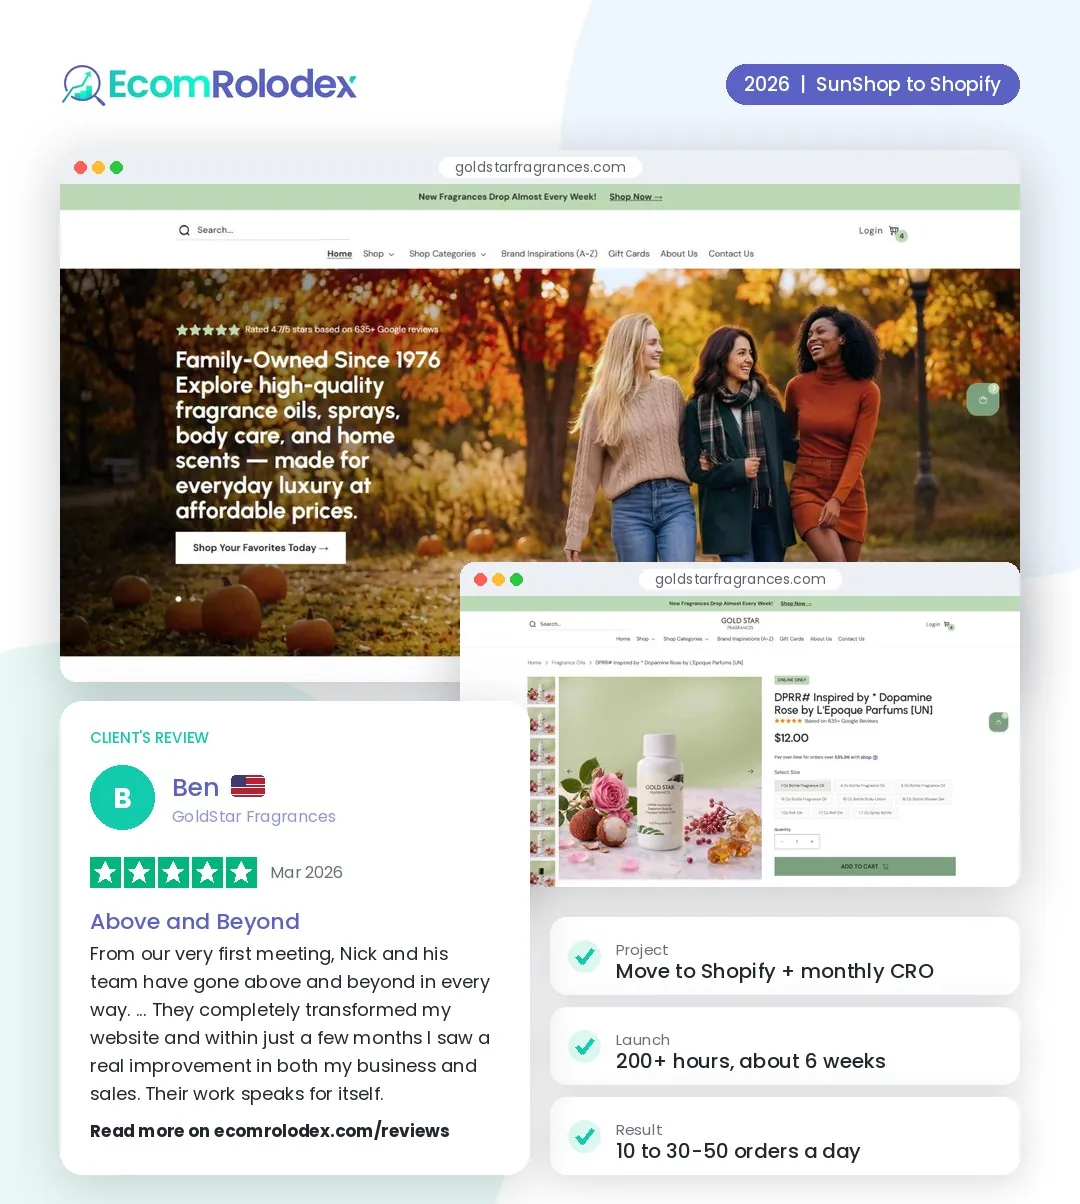
Ben from GoldStar Fragrances: "within just a few months I saw a real improvement in both my business and sales."
Why your Shopify conversion rate looks wrong
Before you change anything on the store, make sure the number is real. These are the 3 things I check first.
Bots and fake sessions
Bots count as sessions but never buy. In September I flagged bot traffic on an Australian jewellery store we've worked with since 2019 (287,000 sessions in that report). When bots fill your sessions, your conversion rate drops even if your real buyers do exactly the same as last month. If sessions jump and orders don't, look at where the sessions come from before you blame the store.
Small numbers
With 300 sessions a month, one order moves your rate by a third of a percent. Look at 30 days at the very least, 90 if your store is small. When we test a change, we compare the week after with the week before, and then check again a few weeks later.
Sales, holidays and your traffic mix
Black Friday week will show a higher rate, a quiet January a lower one. Compare the same weeks. And if you ran more ads this month, your rate will usually go down, because cold visitors buy less than people who already know you. That's not the store getting worse.
Not sure which one it is? The free Store Analyzer shows your speed, reviews, cart and product page in one report, so you can rule out the store side in a minute.
Conversion rate by device and by traffic source
Mobile vs desktop
Contentsquare's retail data, quoted in Shopify's guide, puts desktop at 3.7% and mobile at 2%. Most of your visitors are on a phone, so that gap is where the money is. At GoldStar about 8 in 10 visitors shop on a phone, so we design every page for mobile first in Figma and check desktop after.
Traffic source
People who come from your emails already know you, so they buy more often than people who see an ad for the first time. At GoldStar, email automations brought 35% more revenue. At the small skincare store in Canada, 59% of sales in a 30 day window came from email after we set up her flows.
So when someone tells me their conversion rate dropped, my first question is: did your traffic change? A new ad campaign can pull the rate down while your orders go up.
What moves a Shopify conversion rate first (the order we work in)
This is the order we follow on most stores. Each step is cheaper than the next one, so you stop when the numbers say you're done.
1. The product page on a phone
Price, reviews, the add to cart button and a delivery line should all show without scrolling on a phone. I see a lot of stores lose sales on small things, like no delivery time near the button. On IceBathTubs, the new product page took add to cart from 2.48% to 5.9%.
2. Reviews where people decide
From our projects: 17 reviews nobody could see
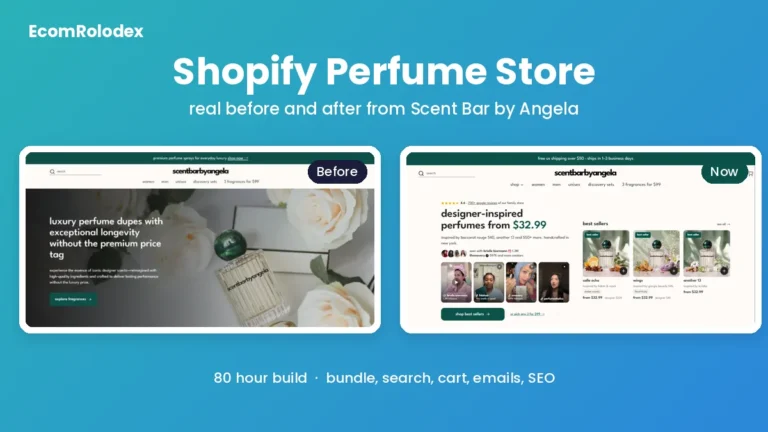
A perfume store we work on had 17 Judge.me reviews that stopped showing on the product pages after the store moved to a new theme. The old price also didn't show crossed out next to the sale price.
Both were among the first fixes we made there in October. Reviews and a clear old price are the things a shopper looks at right before add to cart, and neither one needs a new app.
3. The cart
The cart is where people change their mind. We worked on the cart for More Than Lips, a vegan lip balm brand in Toronto, and conversion went up 54% in 90 days. The full breakdown is in the More Than Lips cart case study.
Not sure where your store loses buyers?
Our $49 store review checks your product page, cart, checkout and more on a phone, and tells you what to fix first. Ready in 48 hours, with a money back guarantee.
4. Speed on phones
Speed matters most on mobile. On November 11 we spent about 5 hours on GoldStar's speed without changing the design. Google's phone score for the homepage went from 51 to 63 (55 on a second run), and first paint went from 2.5 to 1.6 seconds. My view: chasing a 95+ score is usually not worth the budget. Getting the first screen to load fast is. More on how we do it on our Shopify speed optimization page.
5. Emails that bring people back
A visitor who leaves today can still buy next week if you have their email. A popup with a reason to sign up, a welcome series and an abandoned cart flow are the 3 we set up first. They don't change the rate of today's visitors, but they raise the share of sessions that come from people who already know you.
6. A redesign, when the base is weak
If the theme fights you on every change, small fixes stop paying off. That's when a redesign makes sense. For the store with $237 average orders, a redesign took conversion from 2.66% to 5.02% in 3 months on the same 14,900 visitors. An education store in Texas went up 242% in the first 7 days after its redesign. You can see that one in the Texas education store story.

A message from a client we've worked with for about 2 years.
Should you fix it yourself or get help?
Be honest about where your store is right now:
- Under 1,000 sessions a month: work on traffic first. The fixes above still help, but you won't see a clear number for a while.
- Under 1%: check bots and tracking yourself first. It costs nothing.
- 1,000+ sessions a month and stuck under 2%: this is where outside eyes pay off fast.
Our $49 store review gives you the fixes in the order I'd do them, in 48 hours. If you want my team to do the work, CRO projects start at 15 hours ($525), and ongoing CRO is usually 20 hours a month or more. The full process is on our Shopify conversion rate optimization page.
FAQ
What is the average conversion rate for a Shopify store?
Shopify doesn't publish an official average for its stores. The numbers most people quote are 1.4% (Statista, all ecommerce visits, Q1 2026) and 2.66% (Dynamic Yield, 400+ brands). Your niche, price and traffic move it a lot.
Is a 2% conversion rate good on Shopify?
It's around average. Shopify's guide notes that 2% is above the luxury and jewelry average and below food and beverage. For most stores I'd aim for 3% and up.
Is a 1% conversion rate bad?
For most niches it's low, but not always. High ticket stores usually convert lower. IceBathTubs was at 0.71% before we started and reached 3.11% six months after launch. If you're under 1%, check for bot traffic first.
Why is my Shopify conversion rate so low?
The usual causes we find: the wrong traffic, a product page that hides the price or reviews on a phone, a slow first screen, and surprise costs at checkout. On one store, the site promised free shipping over $50 while checkout charged $10.95 because the discount had expired. Mismatches like that cost nothing to fix.
Why did my Shopify conversion rate drop suddenly?
Check 4 things: more ad traffic than usual, a jump in bot sessions, an app or theme update that broke something (like reviews that stopped showing), and an expired discount or shipping rule.
What is a good add to cart rate on Shopify?
I don't trust one outside number for this. On our stores, GoldStar sits around 18% of sessions adding to cart (11% in their first month on Shopify), and IceBathTubs, a high ticket store, went from 2.48% to 5.9%. Compare yourself to your own last 90 days.
How long does it take to raise a conversion rate?
Small fixes can show in a week: the education store in Texas went up 242% in the first 7 days, the skincare store in Canada hit 3.02% in 11 days. Bigger work takes about 90 days to read properly. IceBathTubs was up 59% and More Than Lips 54% after 90 days.

Want a higher conversion rate before your next sale?
Send me your store. I'll tell you where it loses buyers and what I'd fix first.
Not ready to talk yet? Run your store through the free Store Analyzer and see your 20+ tips in about 30 seconds.